图片提示词prompt
**Infographic Description**:
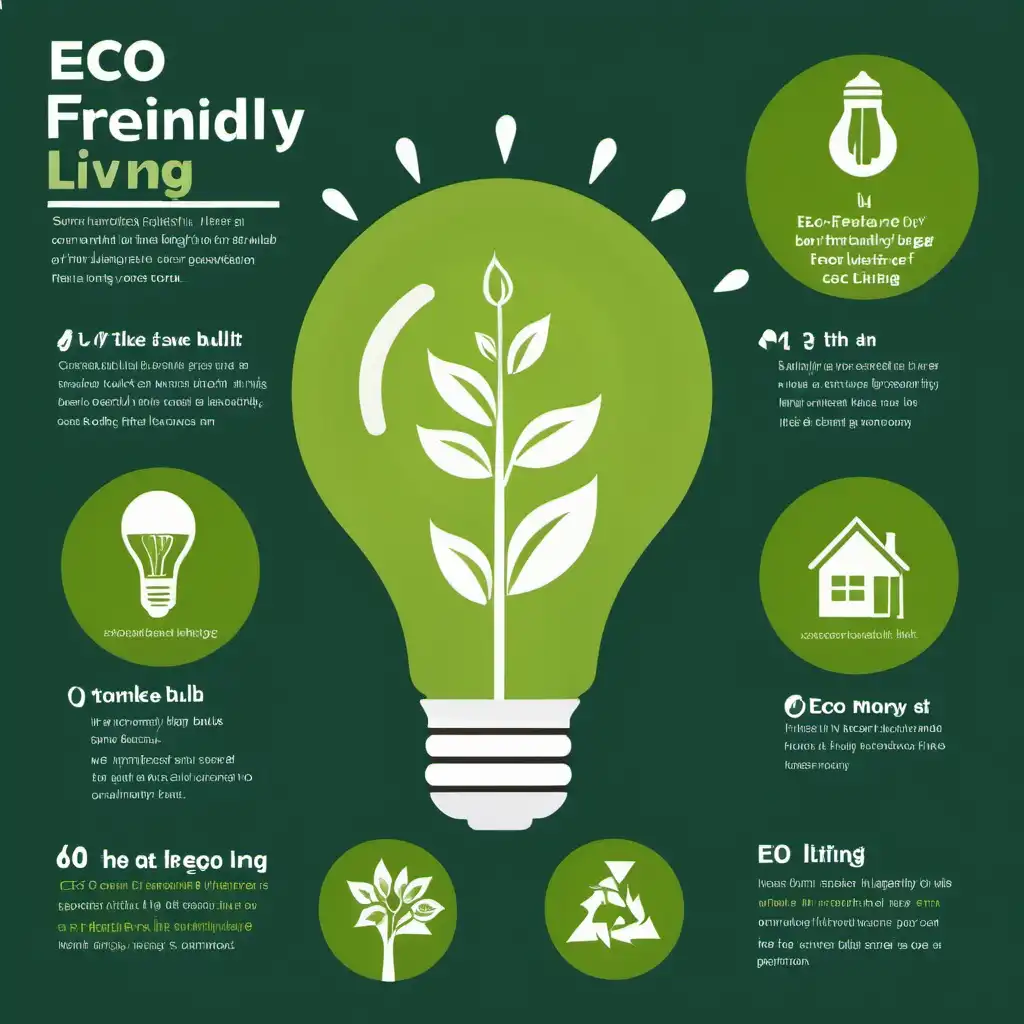
Create an infographic focused on the benefits of eco-friendly living, using a clean and simple design. The infographic should be divided into three sections, each containing an icon and a short description of eco-friendly actions people can take to save money and help the environment.
1. **Section 1**:
- **Icon**: An LED lightbulb.
- **Text**: "Use 25% less energy with LED lights."
2. **Section 2**:
- **Icon**: A solar panel.
- **Text**: "Save up to 50% on electricity with solar power."
3. **Section 3**:
- **Icon**: A reusable bag.
- **Text**: "Cut out 500 plastic bags per year with reusables."
**Additional Instructions**:
- At the top of the infographic, include the title: **"How You Can Save with Eco-Friendly Choices"** in large, bold text.
- Use clean lines, modern fonts, and a color palette with green tones to reflect an eco-friendly theme.
- Include a pie chart at the bottom showing a breakdown of savings:
- **30%** from energy-efficient appliances,
- **25%** from reducing waste,
- **45%** from renewable energy sources.
** 信息图表说明 **:
使用干净简单的设计,创建一个专注于环保生活好处的信息图。信息图应分为三个部分,每个部分包含一个图标和人们可以采取的环保行动的简短描述,以节省金钱和帮助环境。
1. ** 第1节 **:
-** 图标 **: 一个LED灯泡。
-** Text **: “使用led灯可减少25% 的能源。”
2. ** 第2节 **:
-** 图标 **: 太阳能电池板。
-** Text **: “使用太阳能发电最多可节省50% 的电量。”
3. ** 第3节 **:
-** 图标 **: 一个可重复使用的袋子。
-** 文本 **: “每年用可重复使用的塑料袋切出500个。”
** 附加说明 **:
-在信息图的顶部
生成参数
使用模型
模型分类
prompHero 更多作品