图片提示词prompt
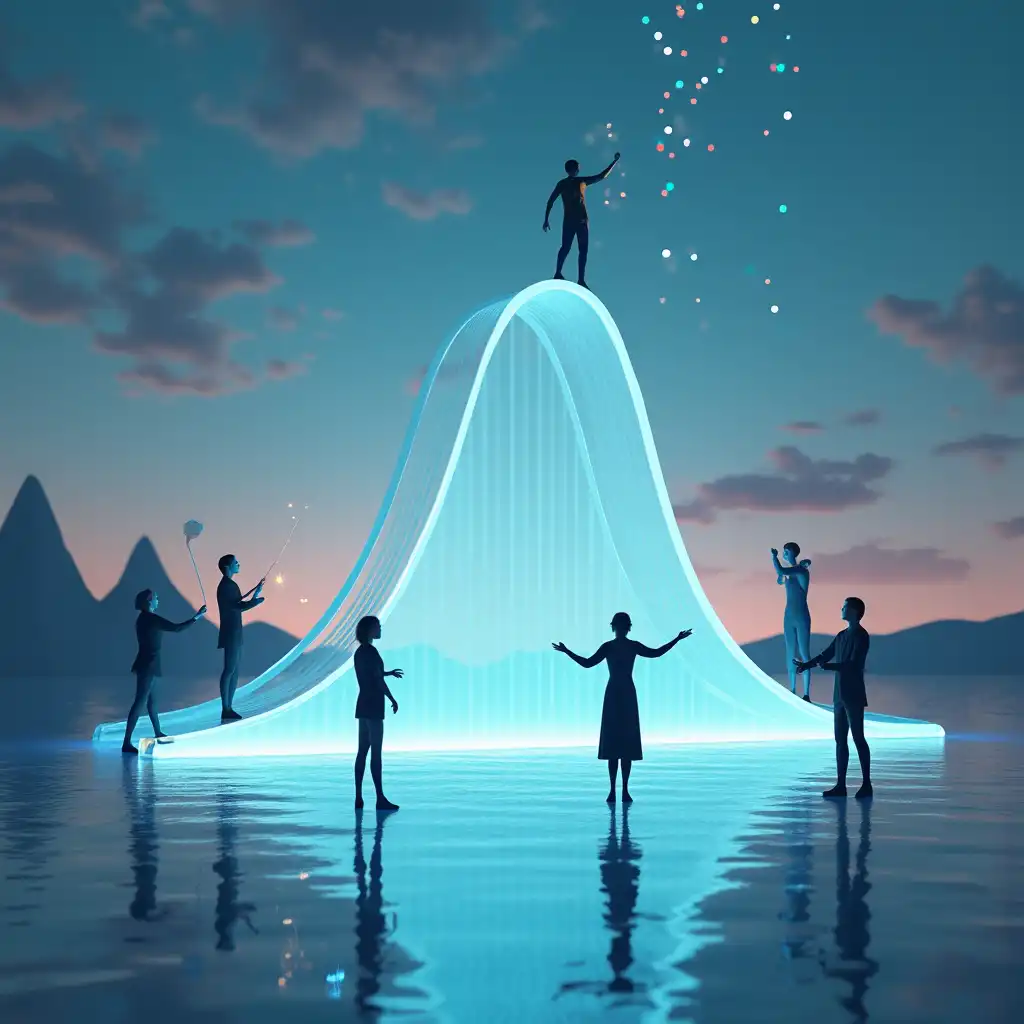
Create a surreal, dreamlike visualization of descriptive statistics where abstract human figures interact with statistical concepts. The scene should take place in a mathematical landscape with the following elements:
In the center, place a large, translucent crystal bell curve (normal distribution) that glows with inner blue light. The curve should be positioned on a reflective surface that creates a mirrored image below.
Around this central feature, position five human silhouettes in different postures:
One figure standing at the peak of the bell curve, arms outstretched like a conductor
One figure measuring the width of the curve with giant golden calipers (representing standard deviation)
Two figures at opposite ends of the curve, drawing lines to mark minimum and maximum values
One figure floating above, dropping colored data points that fall into their appropriate positions along the curve
In the background, create a dreamscape with:
Mountains shaped like box-and-whisker plots silhouetted against a gradient sky
A river of flowing numbers that winds through the scene (representing raw data)
Floating geometric shapes that represent different visualization types (bar charts, pie charts, scatter plots)
Gentle light beams that represent correlation lines between floating variables
The color palette should include:
Deep blues and purples for the background
Bright gold for measurement tools and statistical notations
Translucent whites and blues for the bell curve
Vibrant reds, greens, and blues for data points
Silver for the reflective surface
Add mathematical symbols and notations that appear to be made of starlight, floating in the air: μ (mean), σ (standard deviation), Σ (summation), x̄ (sample mean), and percentile markers.
The overall mood should convey the beauty, precision, and almost mystical nature of how we make sense of data through descriptive statistics. The style should blend elements of surrealism, digital art, and scientific illustration.
创建描述统计的超现实,梦幻般的可视化,其中抽象的人物与统计概念交互。场景应在具有以下元素的数学景观中进行:
在中心,放置一个大的,半透明的水晶钟形曲线 (正态分布),内部蓝光发光。曲线应定位在反射表面上,以在下面创建镜像图像。
围绕这一中心特征
生成参数
使用模型
模型分类
prompHero 更多作品