图片提示词prompt
Create an infographic ranking financial stock parameters from most important to least important. Use a professional design with a mix of dark and light colors. Include the following parameters in order: 1. ROE (5Yrs Avg) > 20% 2. ROCE (5Yrs Avg) > 15% 3. PE < Industry PE 4. Sales Growth 3 Yrs > 15% 5. Profit Growth 5 Yrs > 15% 6. PEG Ratio < 1 7. D/E < 0.5 8. Promotor Holding > 50% 9. Pledged % < 1 10. OPM > 15% 11. EV/EBITDA < 25 12. Price to Sales < 10 13. MCap > 1000 Cr. The infographic should include a brief explanation for each parameter, highlighting its importance." Name it as Arun Subramaniam’s stock screener
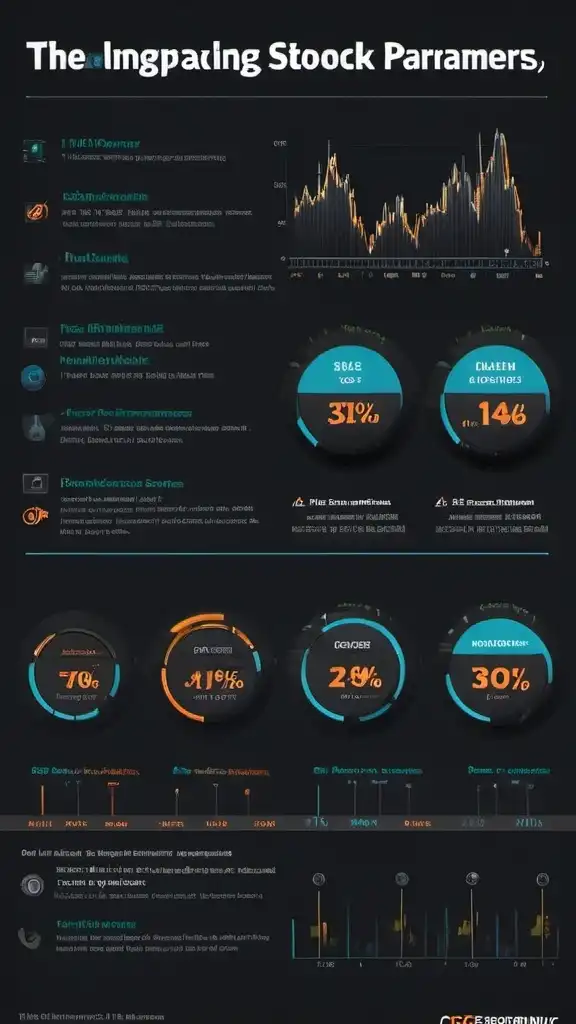
创建从最重要到最不重要的金融股票参数排名信息图。使用深色和浅色混合的专业设计。按顺序包括以下参数: 1.净资产收益率 (平均5年)> 20% 2。ROCE (平均5年)> 15% 3。PE <行业PE 4。销售增长3年> 15% 5年。利润增长5年> 15% 6年。PEG比率 <1 7。D/E <0.5 8.发起人控股> 50% 9。质押 % < 1 10。OPM> 15% 11。企业价值/息税折旧及摊销前利润 <25 12。价格对销售额 <10 13。MCap> 1000 Cr。信息图应包括每个参数的简要说明
生成参数
使用模型
模型分类
prompHero 更多作品