图片提示词prompt
### **Infographic Layout for Physical Vulnerability**
#### **Title**:
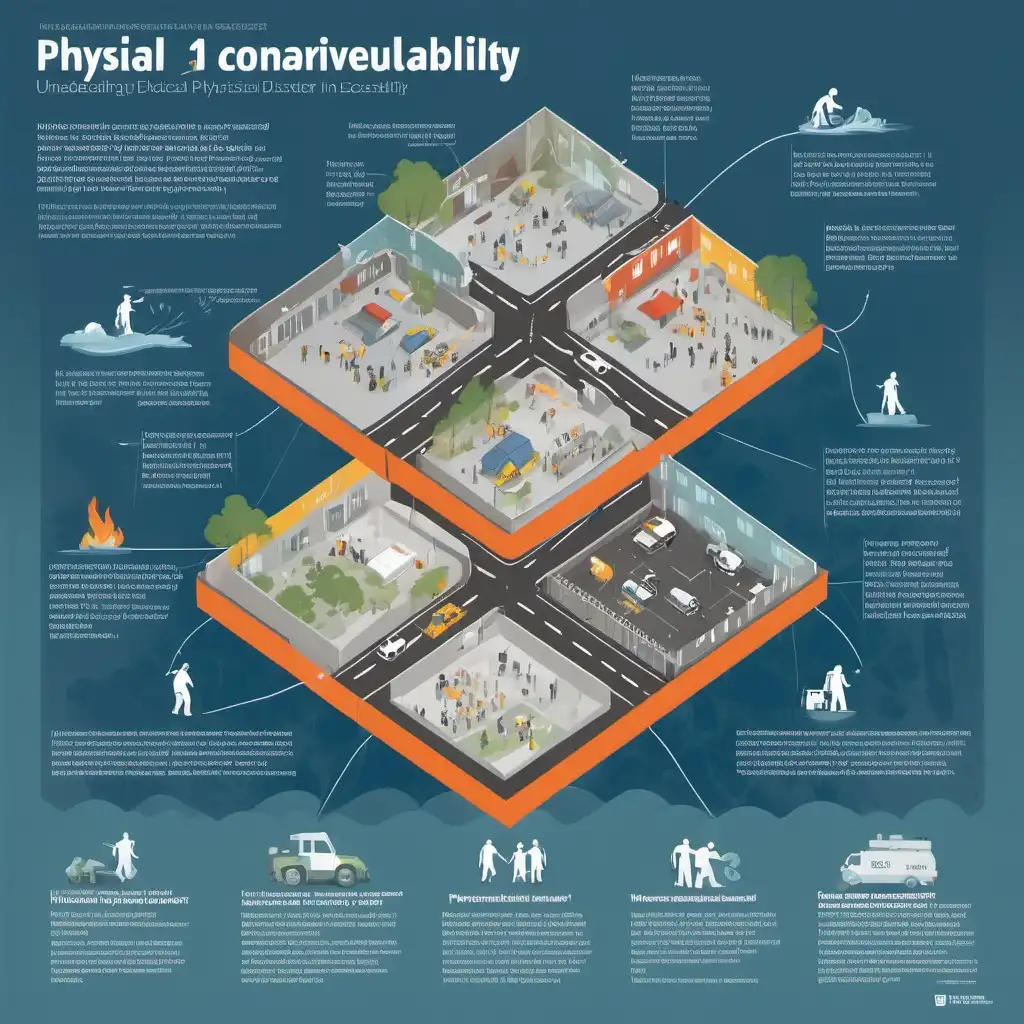
**Understanding Physical Vulnerability in Disaster Contexts**
---
### **Section 1: Definition**
**Physical Vulnerability**
- Difficulty accessing essential resources:
- Water
- Communication
- Hospitals
- Police stations
- Fire brigades
- Roads, bridges, and exits
- Poor construction planning leads to weak structures prone to disasters.
**Visual Idea**: Use an icon cluster of buildings, roads, and bridges with hazard symbols (flood, earthquake, fire).
---
### **Section 2: Key Factors Contributing to Physical Vulnerability**
1. **Population Density**
- Crowded areas = higher risk.
2. **Location and Remoteness**
- Rural or remote areas struggle with disaster response.
3. **Site and Infrastructure Design**
- Poorly built homes and facilities increase vulnerability.
4. **Proximity to Disaster Sources**
- Coastal areas, fault lines, or unstable hills are high-risk zones.
**Visual Idea**: Use a map highlighting a coastal area, fault line, and hilly terrain with icons to represent risks.
---
### **Section 3: Examples of Vulnerable Areas**
- Coastal regions → Tsunamis & storms
- Fault lines → Earthquakes
- Unstable hills → Landslides
**Visual Idea**: A segmented illustration showing each type of area with relevant disaster icons.
---
### **Section 4: Takeaway**
- Strengthening infrastructure and improving urban planning reduce physical vulnerability.
- Awareness and preparedness are crucial.
**Visual Idea**: A checklist icon with action points, paired with a strong message like *"Prepare. Plan. Protect."*
---
This layout breaks down the concept into visually digestible sections while maintaining a clean and informative design.
### ** 物理漏洞的信息图表布局 **
#### ** 标题 **:
** 了解灾害环境中的物理脆弱性 **
---
### ** 第1节: 定义 **
** 物理漏洞 **
-难以获得基本资源:
-水
-通信
-医院
-警察局
-消防队
-道路、桥梁和出口
-不良的建筑规划导致脆弱的结构容易发生灾害。
** 视觉理念 **: 使用建筑物的图标集群
生成参数
使用模型
模型分类
prompHero 更多作品