图片提示词prompt
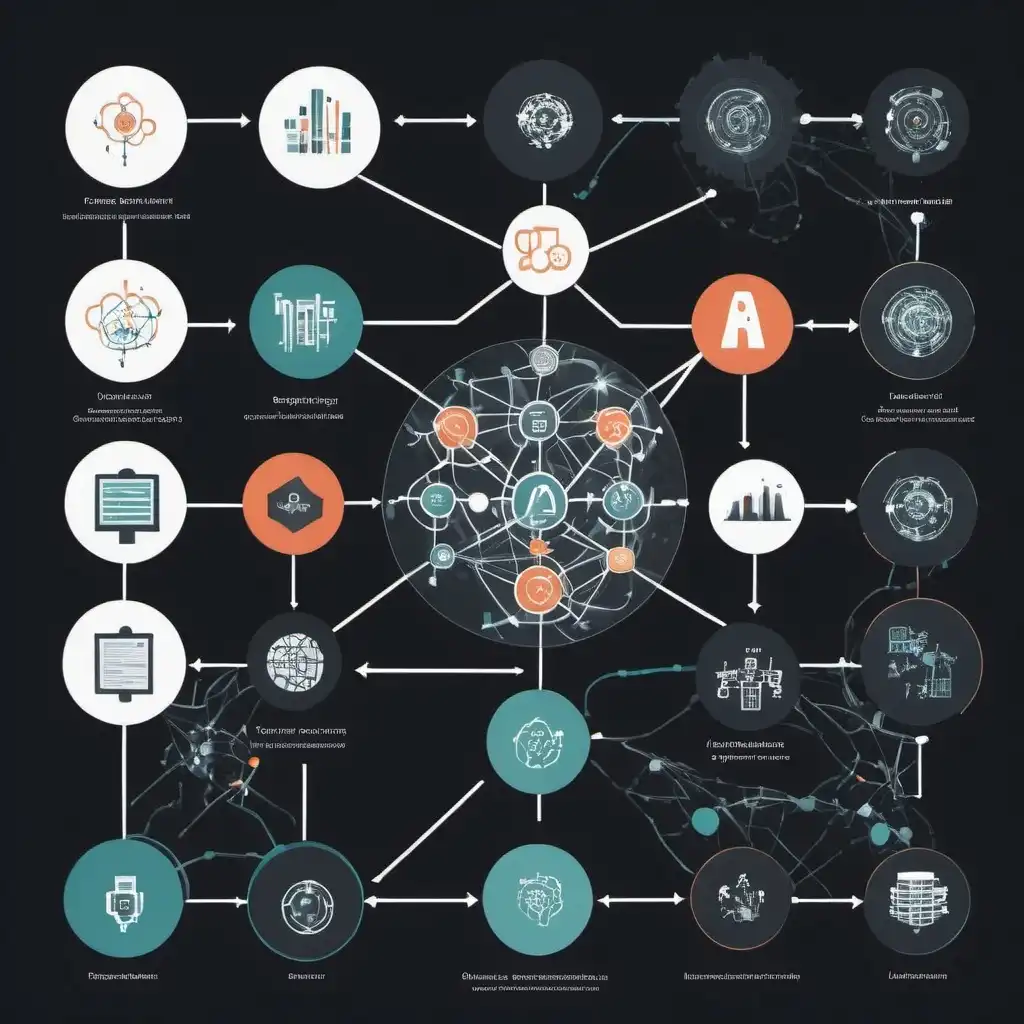
image schema like (that I can use in the presentation) that show overall usage of various machine learning, deep learning, AI, transformers and other elements to interpolate some GIS dynamic data. I want it to has multiple elements on the one picture
像 (我可以在演示文稿中使用) 这样的图像模式,显示了各种机器学习,深度学习,AI,变压器和其他元素的整体使用情况,以插值一些GIS动态数据。我希望它在一张图片上有多个元素
生成参数
使用模型
模型分类
prompHero 更多作品