图片提示词prompt
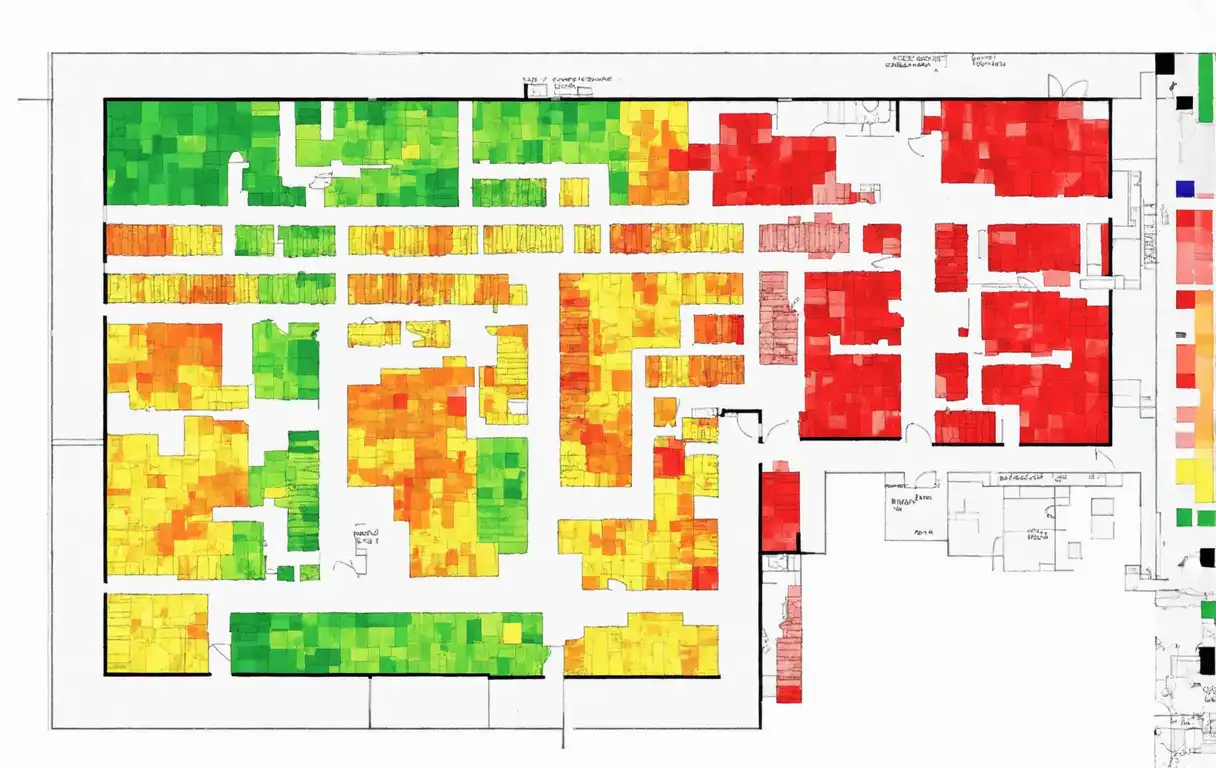
Generate organic heatmap of a large floor plan, likely representing occupancy, network coverage, or similar metrics across different rooms and areas in a building. The floor plan includes several rooms with varying degrees of color intensity, where:
Green areas might indicate low activity, low usage, or strong coverage, depending on the map's purpose.
Yellow and orange areas seem to indicate moderate levels of activity or weaker coverage.
Red or darker orange areas could represent high activity, congestion, or the weakest coverage.
The rooms are separated by walls, with corridors or common spaces connecting them. The heatmap is distributed unevenly, which could reflect how resources (such as seating, occupancy, or wireless signals) are being used or distributed throughout the building.
This type of image is commonly used for facilities management, network planning, or occupancy studies.
DISTINCT ZONES - MEETING ROOMS AND WORK PLACES. VERY VERY DETAILED.
生成大型平面图的有机热图,可能代表建筑物中不同房间和区域的占用率、网络覆盖率或类似指标。平面图包括几个颜色强度不同的房间,其中:
生成参数
使用模型
模型分类
prompHero 更多作品